
I got this map off of wikipedia, but it was originally made by National Center for Ecological Analysis and Synthesis. It's a map of oceanic shipping lanes around the world. It was made to show the impact that shipping has on the ocean. I personally think it's an awesome map for a couple reasons. First, I like how they decided to not actually show land, but instead just leave it blank. You can still easily make out all the continents (except Antarctica) because there are shipping lanes covering the entire ocean, so that lack of them on land really stands out. I also like how it shows the scope of the oceanic shipping industry.

I got this map from www.anacapaschool.org. It's from a club I was in in high school that sent a high altitude balloon to 91,000 ft (near space) to take pictures of the curvature of the Earth. It depicts the projected flight path of the balloon (solid black line) and the actual flight path of the balloon (red dotted line). The balloon's flight moves from West to East. The actual flight path launches from a different point than the predicted launch which is why the two paths are offset. I think it's a cool map because the S-curve shows how winds go in different directions at different altitudes. I also think it's amazing how close the prediction was to the actual flight path (just offset).
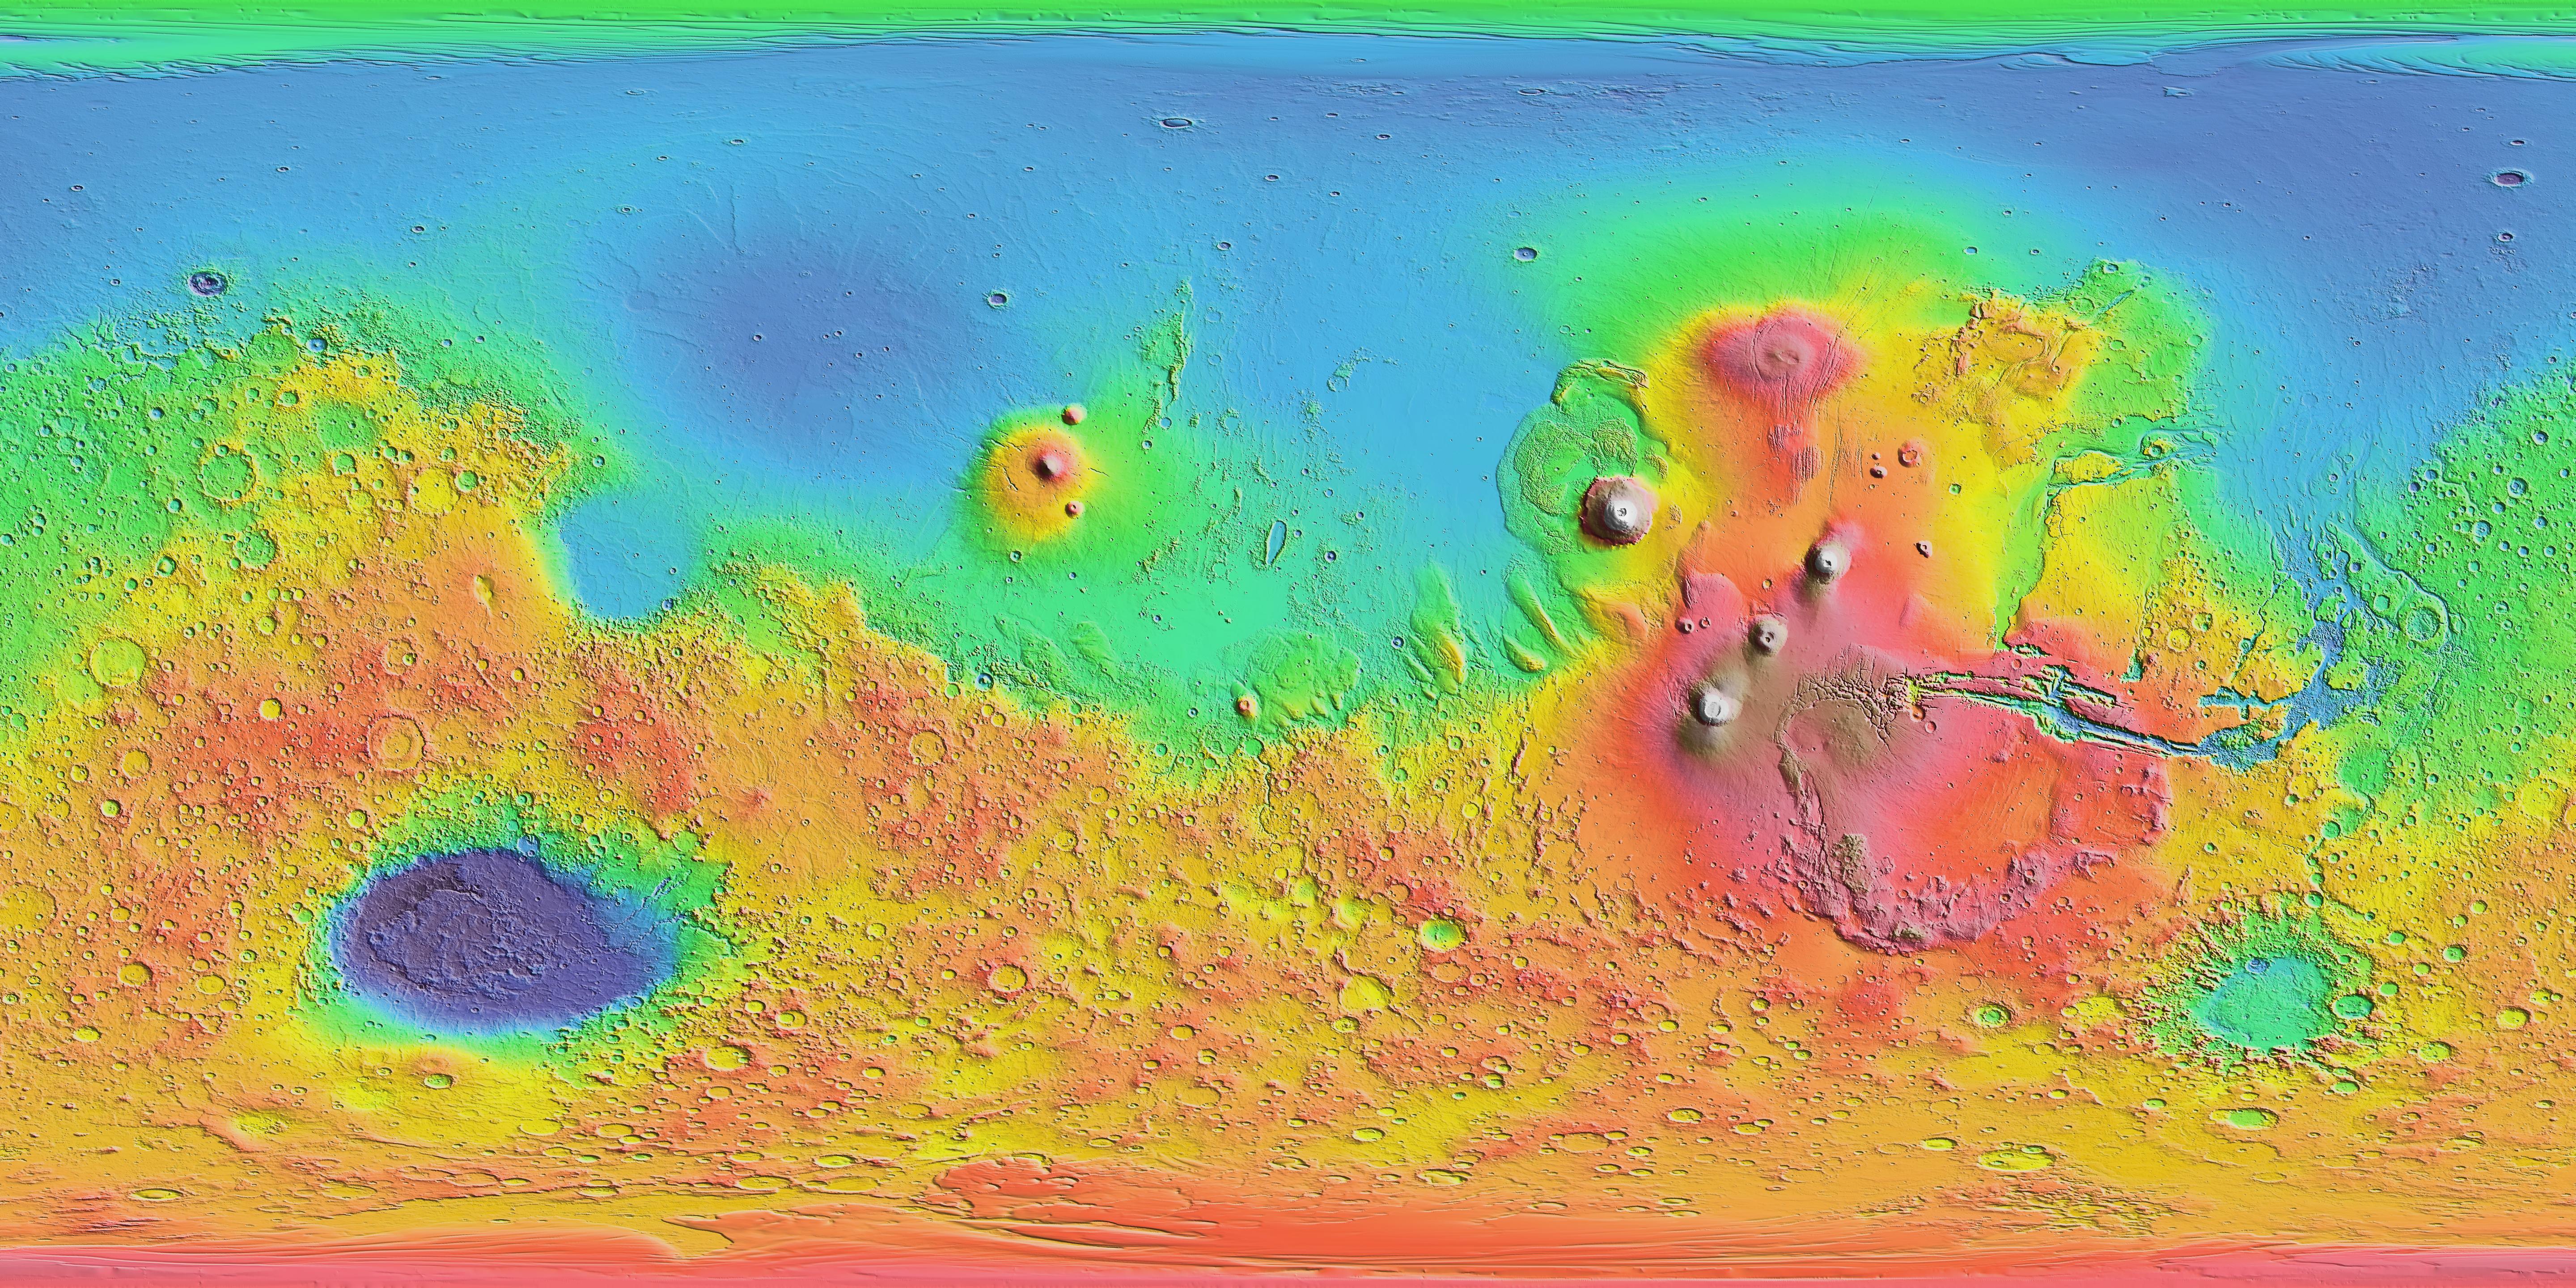
This is a map of Mars as provided by NASA. It show elevation using colors and uses cylindrical projection. It was made by the Mars Orbiter Laser Altimeter which was on the Mars Global Surveyor spacecraft over the course of three years. I think it's awesome because it of Mars! Any map of Mars is cool! This one is also has lots of pretty colors.